PhilJay / MPAndroidChart
A powerful 🚀 Android chart view / graph view library, supporting line- bar- pie- radar- bubble- and candlestick charts as well as scaling, panning and animations.
AI Architecture Analysis
This repository is indexed by RepoMind. By analyzing PhilJay/MPAndroidChart in our AI interface, you can instantly generate complete architecture diagrams, visualize control flows, and perform automated security audits across the entire codebase.
Our Agentic Context Augmented Generation (Agentic CAG) engine loads full source files into context, avoiding the fragmentation of traditional RAG systems. Ask questions about the architecture, dependencies, or specific features to see it in action.
Embed this Badge
Showcase RepoMind's analysis directly in your repository's README.
Repository Summary (README)
Preview

![]()
![]()

![]()
:zap: A powerful & easy to use chart library for Android :zap:
Charts is the iOS version of this library
Table of Contents
Gradle Setup
repositories {
    maven { url 'https://jitpack.io' }
}

dependencies {
    implementation 'com.github.PhilJay:MPAndroidChart:v3.1.0'
}
Maven Setup
<!-- <repositories> section of pom.xml -->
<repository>
    <id>jitpack.io</id>
   <url>https://jitpack.io</url>
</repository>

<!-- <dependencies> section of pom.xml -->
<dependency>
    <groupId>com.github.PhilJay</groupId>
    <artifactId>MPAndroidChart</artifactId>
    <version>v3.1.0</version>
</dependency>
See the documentation for examples and general use of MPAndroidChart.
See the javadocs for more advanced documentation.
<br/> <h2 id="examples">Examples :eyes:</h2>Download the MPAndroidChart Example App or look at the source code.

This repository's issue tracker is only for bugs and feature requests. The maintainers ask that you refrain from asking questions about how to use MPAndroidChart through the issue tracker.
Please read the documentation first, then ask all your questions on stackoverflow.com for the fastest answer.
<br/> <h2 id="donate">Donations :heart:</h2>This project needs you! If you would like to support this project's further development, the creator of this project or the continuous maintenance of this project, feel free to donate. Your donation is highly appreciated (and I love food, coffee and beer). Thank you!
PayPal
- Donate 5 $: Thank's for creating this project, here's a coffee (or some beer) for you!
- Donate 10 $: Wow, I am stunned. Let me take you to the movies!
- Donate 15 $: I really appreciate your work, let's grab some lunch!
- Donate 25 $: That's some awesome stuff you did right there, dinner is on me!
- Or you can also choose what you want to donate, all donations are awesome!
If you like this library, please tell others about it :two_hearts: :two_hearts:
![]()
![]()
![]()
If you like, you can follow me on Twitter @PhilippJahoda.
<br/> <h2 id="more-examples">More Examples :+1:</h2> <br/>LineChart (with legend, simple design)
 <br/><br/>
LineChart (with legend, simple design)
 <br/><br/>
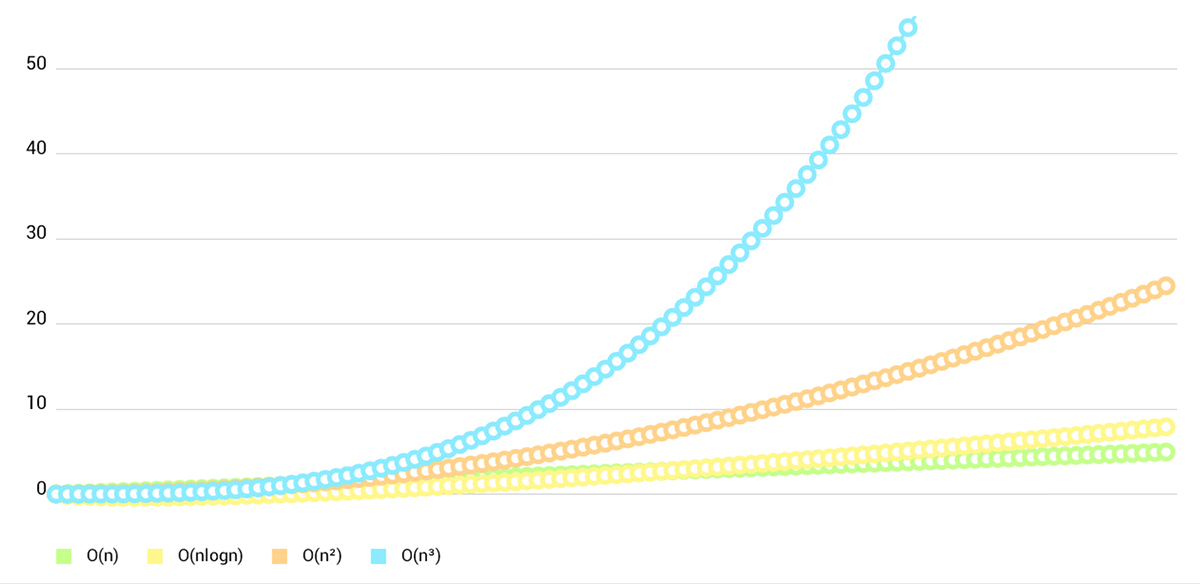
LineChart (cubic lines)
 <br/><br/>
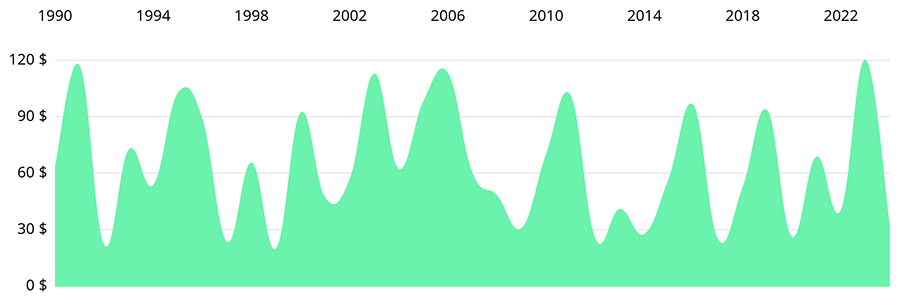
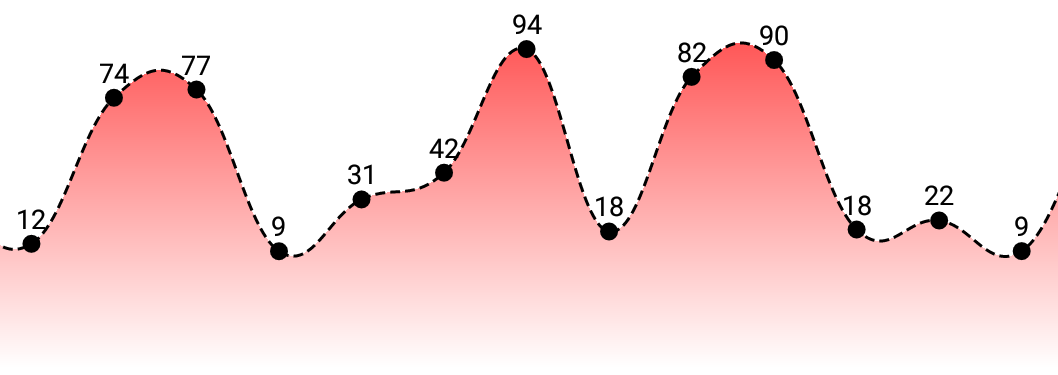
LineChart (gradient fill)
 <br/><br/>
BarChart (with legend, simple design)
 <br/><br/>
BarChart (grouped DataSets)
 <br/><br/>
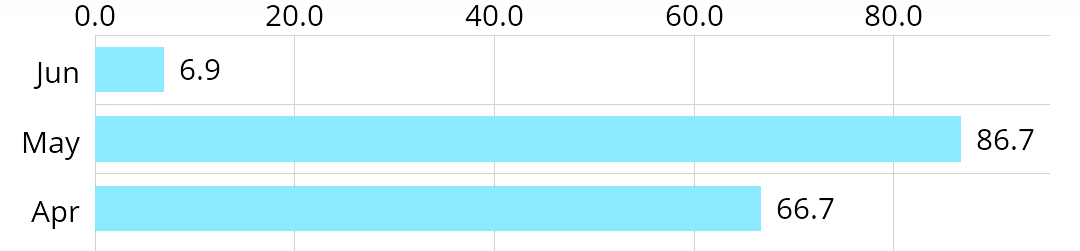
Horizontal-BarChart
 <br/><br/>
Combined-Chart (bar- and linechart in this case)
 <br/><br/>
PieChart (with selection, ...)
 <br/><br/>
ScatterChart (with squares, triangles, circles, ... and more)
 <br/><br/>
CandleStickChart (for financial data)
 <br/><br/>
BubbleChart (area covered by bubbles indicates the yValue)
 <br/><br/>
RadarChart (spider web chart)

Copyright 2020 Philipp Jahoda
Licensed under the Apache License, Version 2.0 (the "License"); you may not use this file except in compliance with the License. You may obtain a copy of the License at
Unless required by applicable law or agreed to in writing, software distributed under the License is distributed on an "AS IS" BASIS, WITHOUT WARRANTIES OR CONDITIONS OF ANY KIND, either express or implied. See the License for the specific language governing permissions and limitations under the License.
<br/> <h2 id="creators">Special Thanks :heart:</h2>These people rock!
- danielgindi - Daniel Gindi
- mikegr - Michael Greifeneder
- tony - Tony
- almic - Mick A.
- jitpack.io - JitPack.io